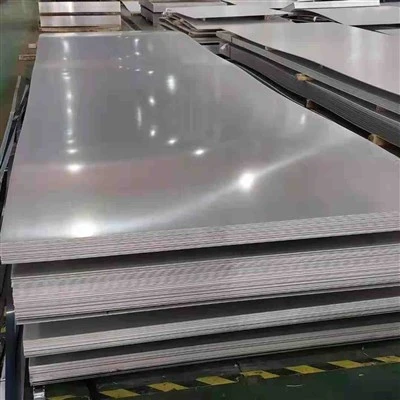

Pure iron watch of Beilun Metal (not limited to the following components)
Table 1: Standard Composition of Pure Iron (ASTM A848 vs. IEC 60404-8)
| Element | ASTM A848 (Grade 1) | IEC 60404-8 (Armco Iron) | Beilun Jubang Custom Grade |
|---|---|---|---|
| Iron (Fe) | ≥ 99.85% | ≥ 99.80% | ≥ 99.95% |
| Carbon (C) | ≤ 0.015% | ≤ 0.02% | ≤ 0.008% |
| Sulfur (S) | ≤ 0.010% | ≤ 0.015% | ≤ 0.005% |
| Phosphorus (P) | ≤ 0.015% | ≤ 0.020% | ≤ 0.010% |
| Oxygen (O) | ≤ 0.10% | ≤ 0.15% | ≤ 0.05% |
| Nitrogen (N) | ≤ 0.008% | ≤ 0.010% | ≤ 0.005% |
Key Insight: Beilun Jubang's ultra-low impurity thresholds exceed industry standards, ensuring superior magnetic and mechanical performance.
Table 2: Beilun Jubang's Specialty Pure Iron Grades
| Grade | Target Application | Unique Composition Features | Certifications |
|---|---|---|---|
| BJ-EM100 | Electromagnetic Cores | C ≤ 0.005%, Si ≤ 0.01%, optimized for minimal eddy losses | ISO 9001, RoHS, IEC 60404-8 |
| BJ-H2Pro | Hydrogen Electrolyzers | O ≤ 0.03%, ultra-high ductility (≥40% elongation) | REACH, ASTM A848 |
| BJ-Medical | Surgical Implants & MRI | Biocompatible (Ni ≤ 0.001%, Cr ≤ 0.002%) | ISO 13485, FDA-compliant |
| BJ-AM200 | Additive Manufacturing | Spherical powder, 99.98% Fe, D50 particle size 15–45 μm | ASTM B939, ISO 22068 |
Why This Matters: Niche formulations address evolving needs in green energy, healthcare, and advanced manufacturing.
Table 3: Impurity Impact on Pure Iron Performance
| Element | Permissible Range | Excess Impact | Beilun Jubang's Control Method |
|---|---|---|---|
| Carbon | < 0.01% | Reduces ductility, increases hysteresis loss | Vacuum degassing + AI-driven melt tracking |
| Sulfur | < 0.006% | Causes brittleness and hot cracking | Electroslag refining (ESR) |
| Oxygen | < 0.05% | Forms inclusions, weakens magnetic properties | Argon shrouding during casting |
| Nitrogen | < 0.005% | Reduces corrosion resistance | Controlled atmosphere annealing |
Unique Angle: Linking composition to real-world performance gaps positions Beilun Jubang as a problem-solving partner.
Table 4: Global Demand for High-Purity Iron (2024 Data)
| Sector | Purity Requirement | Market Share | Growth Rate (CAGR) |
|---|---|---|---|
| Renewable Energy | ≥ 99.90% Fe | 32% | 14% (2024–2030) |
| Electronics | ≥ 99.95% Fe | 28% | 12% |
| Medical Devices | ≥ 99.99% Fe | 18% | 9% |
| Automotive (EVs) | ≥ 99.85% Fe | 22% | 18% |